
BLOG
How accurate is photo-based posture analysis? What the studies tested and on whom
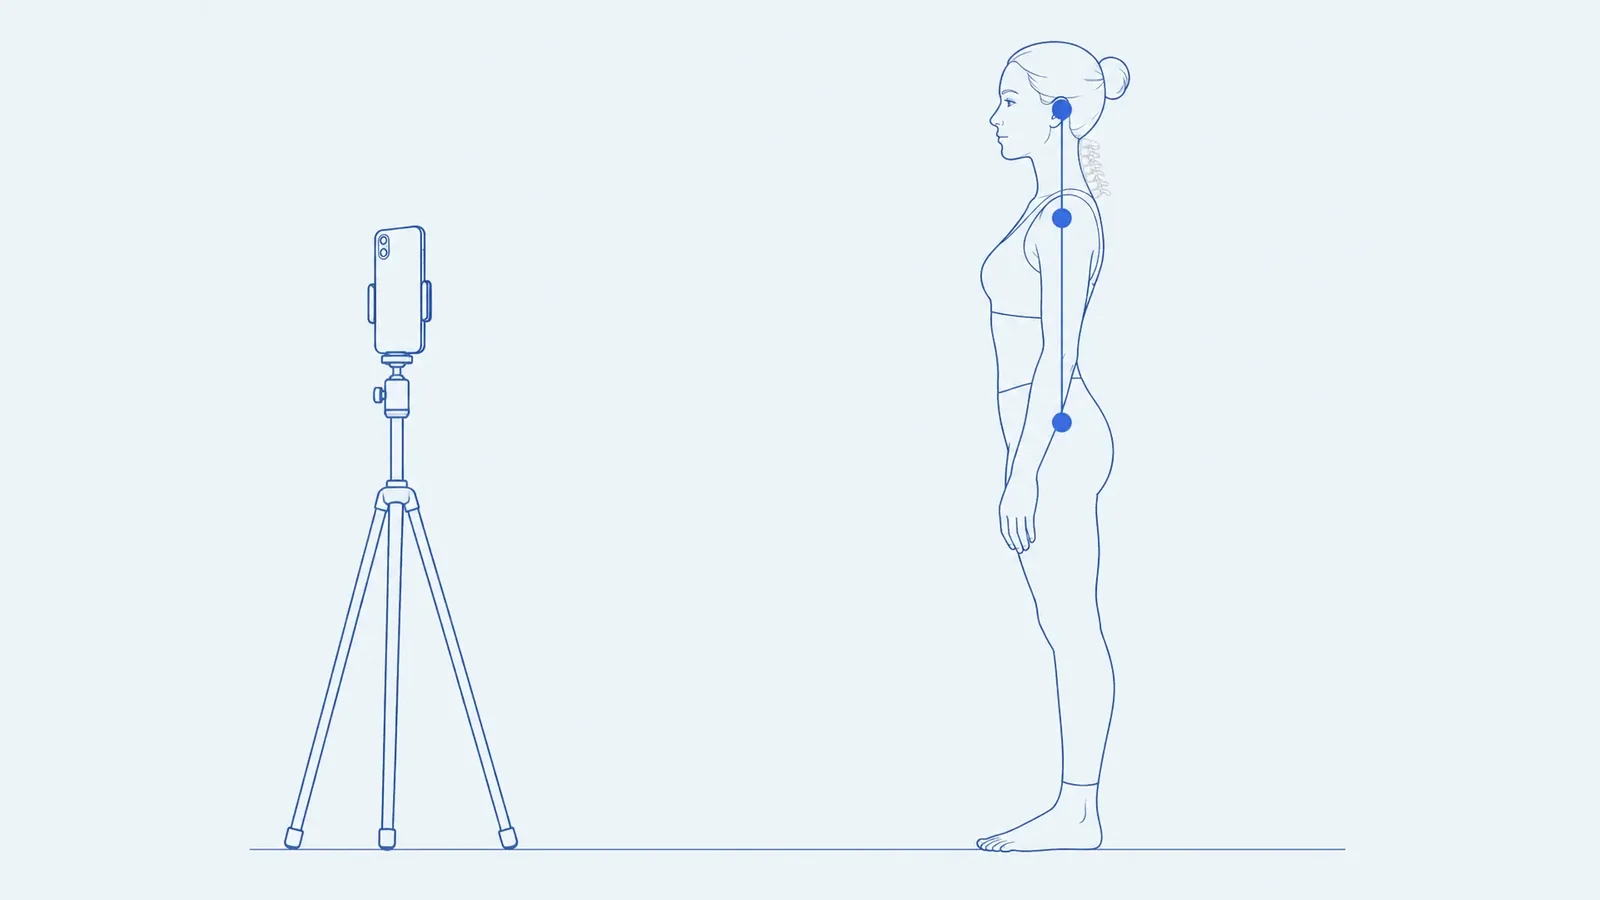
Photo-based posture measurements mostly repeat well when photos are taken the same way, but how closely they match X-rays or 3D motion capture depends on the measurement. A 2025 meta-analysis of smartphone photo apps found excellent pooled reliability for the neck (craniovertebral) angle in 86 people, but no proven agreement with reference methods for hip tilt. The app studies below each tested 10 to 100 people, mostly healthy young adults, so results do not carry over to every app.
Reliability and validity are different questions
Accuracy studies ask two separate questions, and a tool can do well on one and poorly on the other.
- Reliability asks whether you get the same number again: from a second examiner (inter-rater), or on a second photo or day (test-retest). It is usually reported as an intraclass correlation coefficient (ICC), where values closer to 1 mean more consistent results.
- Validity asks whether the number reflects the real body position. Researchers compare it with a reference such as an X-ray, a 3D motion capture system with skin markers, or sometimes another photo analysis program.
Most posture photo research measures reliability. Far fewer studies measure validity, because the reference methods involve radiation or laboratory equipment.
What the reviews found
The abstract of the most recent review reports only reliability figures and concludes that they support clinical use. The validity figures in its results are more mixed.
A 2025 systematic review and meta-analysis in Scientific Reports (Karbalaeimahdi et al.) included 29 studies with 1,910 participants and eight image-based smartphone apps. Only four angles had enough studies to pool:
| Measurement | Inter-rater reliability (ICC) | Test-retest reliability (ICC) | Validity against a reference |
|---|---|---|---|
| Craniovertebral angle (side view) | 0.889 (n = 86) | 0.904 (n = 86) | 0.938 (n = 131), with high variation between studies, mainly against other photo analysis software |
| Head tilt (side view) | 0.962 (n = 50) | 0.898 (n = 100) | Not pooled |
| Acromion (shoulder) alignment (front view) | 0.904 (n = 170) | 0.771 (n = 120) | 0.603 (n = 40) |
| Hip tilt (front view) | 0.842 (n = 170) | 0.642 (n = 120) | 0.462 (n = 40), not statistically significant (p = 0.36) |
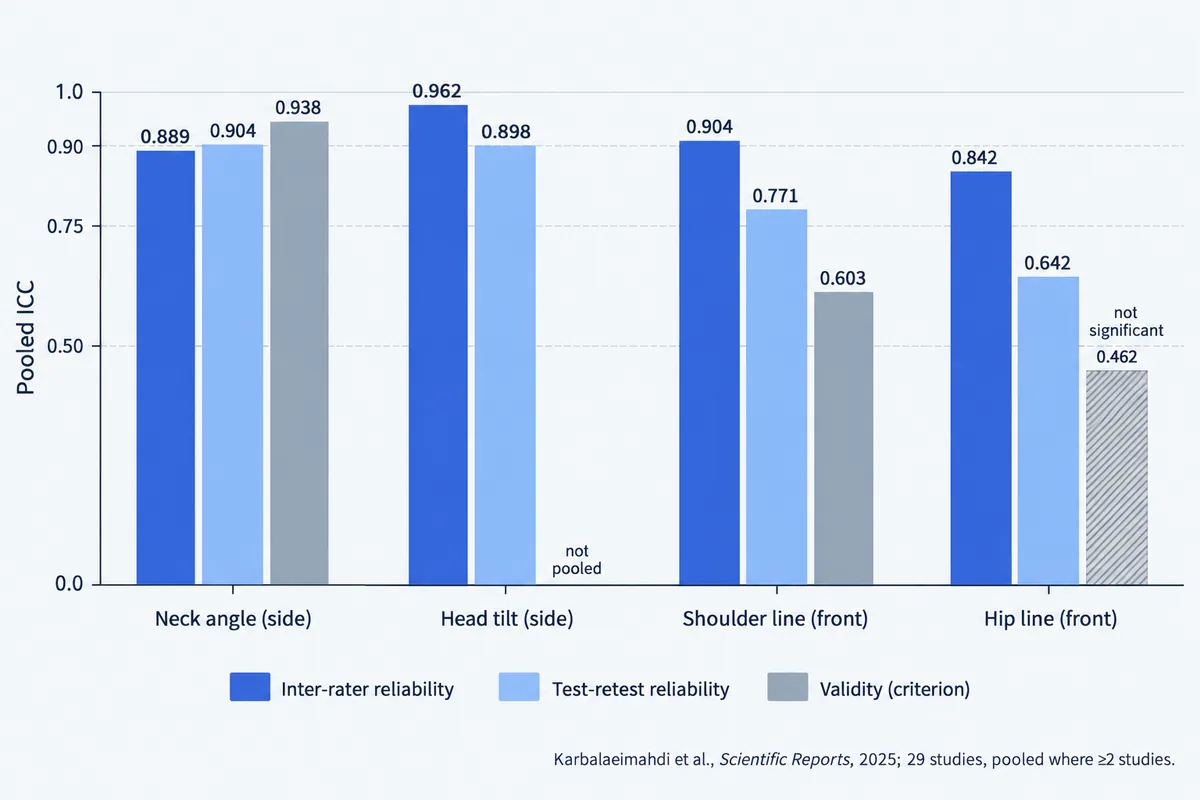
For the neck angle, the pooled reliability is high but comes from only 86 people, and the pooled validity is high but varied widely between studies and was measured mostly against other 2D photo analysis software rather than X-rays or 3D motion capture. For the shoulder and hip lines seen from the front, examiners agree with each other well, but repeat photos agree less, and agreement with the reference was moderate for the shoulders and unproven for the hips. Across the review, the reference methods included a VICON 3D motion capture system and Kinovea, which is itself 2D video analysis software; none of the pooled comparisons used X-rays. The authors concluded that image-based apps are "a viable, cost-effective tool for postural screening" but need more methodological rigor before they can reliably track clinically significant changes over time.
Two older reviews point the same way. A 2022 systematic review of forward head posture measurement (Mylonas et al., Cureus, 21 studies) rated reliability moderate to excellent, with the best evidence for classic photogrammetry, found the validity evidence not conclusive, and stated that X-ray evaluation "will remain essential" for forward head posture in clinical care. A 2017 literature review (Singla et al., Journal of Chiropractic Medicine), which its authors say is not systematic, found moderate to high intra-rater reliability for photo angles such as the craniovertebral angle, and two studies with moderate to strong correlations with X-ray angles. In one of them, a study of 80 women aged 19 to 35 (Weber and colleagues), the photo neck angle and a comparable X-ray angle correlated at r = 0.68, which the review calls moderate.
The validation study of the SAPO posture software (Ferreira et al., Clinics, 2010) shows where the error comes from. Measuring a rigid object with known angles, the software was off by 0.11° on average. On photos of 22 people, 76% of variables reached very good or excellent agreement between raters and 14% did not reach an acceptable level. The software measures lines precisely; finding the same body landmark on every photo is the hard part.
What studies of individual apps tested
Results depend on the app, the measurement and who was photographed. Each study below tested a small, specific group.
| Study | App and setup | Who was tested | Compared with | Main finding |
|---|---|---|---|---|
| Boland et al., 2016 | PostureScreen Mobile on an iPad; 3 examiners placed landmarks | 10 young adults (mean age 21) | Other examiners; a second visit | Substantial or almost perfect agreement for most measures; better with minimal clothing |
| Szucs and Donoso Brown, 2018 | PostureScreen Mobile on an iPad, with reflective skin markers | 20 healthy volunteers (mean age 21) | Other raters; repeat ratings | Intra-rater ICC 0.71 to 0.99; position shifts more reliable than angles |
| Hopkins et al., 2019 | PostureScreen Mobile (iOS) | 50 men without symptoms (mean age 24) | VICON 3D motion capture | Most measures were biased; only head shift was comparable. The authors advise caution when highly accurate assessment is needed |
| Trovato et al., 2022 | APECS, four photos per person, 3 examiners | 100 healthy young adults (mean age 23) | Other examiners only | 13 of 22 variables had ICC above 0.90; 6 did not reach the cut-off. No comparison with a reference instrument |
| Timurtaş et al., 2022 | Fizyoprint, 2 physiotherapists, 1 week apart | 20 young adults (mean age 21) | BioTonix posture system | 80.7% of variables acceptable to excellent within raters, 57.7% between raters |
| Park et al., 2025 | MORA Vu, fully automatic landmarks, iPad on a tripod at 3 m | 72 orthopedic outpatients with neck or knee complaints (36 per group) | X-rays | Forward head measure vs X-ray craniovertebral angle r = −0.71, but no correlation with the X-ray cervical curve (Cobb) angle; leg alignment vs X-ray r = 0.75; ICC 0.84 and 0.90 between examiners |
Two patterns repeat. Reliability changes from one measurement to the next within the same app, so a single "accuracy" figure for an app hides a lot. And most samples are small groups of healthy young adults, so the results may not carry over to older people or people with musculoskeletal conditions, as the APECS authors point out themselves.
Apps that place landmarks automatically
In most studies above, trained people clicked the landmarks by hand or used skin markers. Many newer apps, PoseAlign among them, detect pose landmarks in the photo automatically instead of having a person click them. That removes manual point-placement differences on the same image, but differences in photo setup remain, along with the detection method's own error, which depends on image quality, clothing and viewing angle.
Evidence for automatic landmarks on standing posture photos is still thin. The Park 2025 study is the closest match: in 72 clinic patients, its forward head and leg alignment measures correlated with comparable X-ray angles at around 0.7, while the forward head measure showed no correlation with the X-ray curve of the neck. It is a pilot study, three of its authors work for the company that makes MORA Vu, and its authors say the small sample limits how far the results generalize. Other work tests movement rather than standing posture: in a 2024 walking study with five smartphones and 20 healthy adults, most participants' joint angle errors were under 5° against a marker-based system, and accuracy depended on where each phone stood.
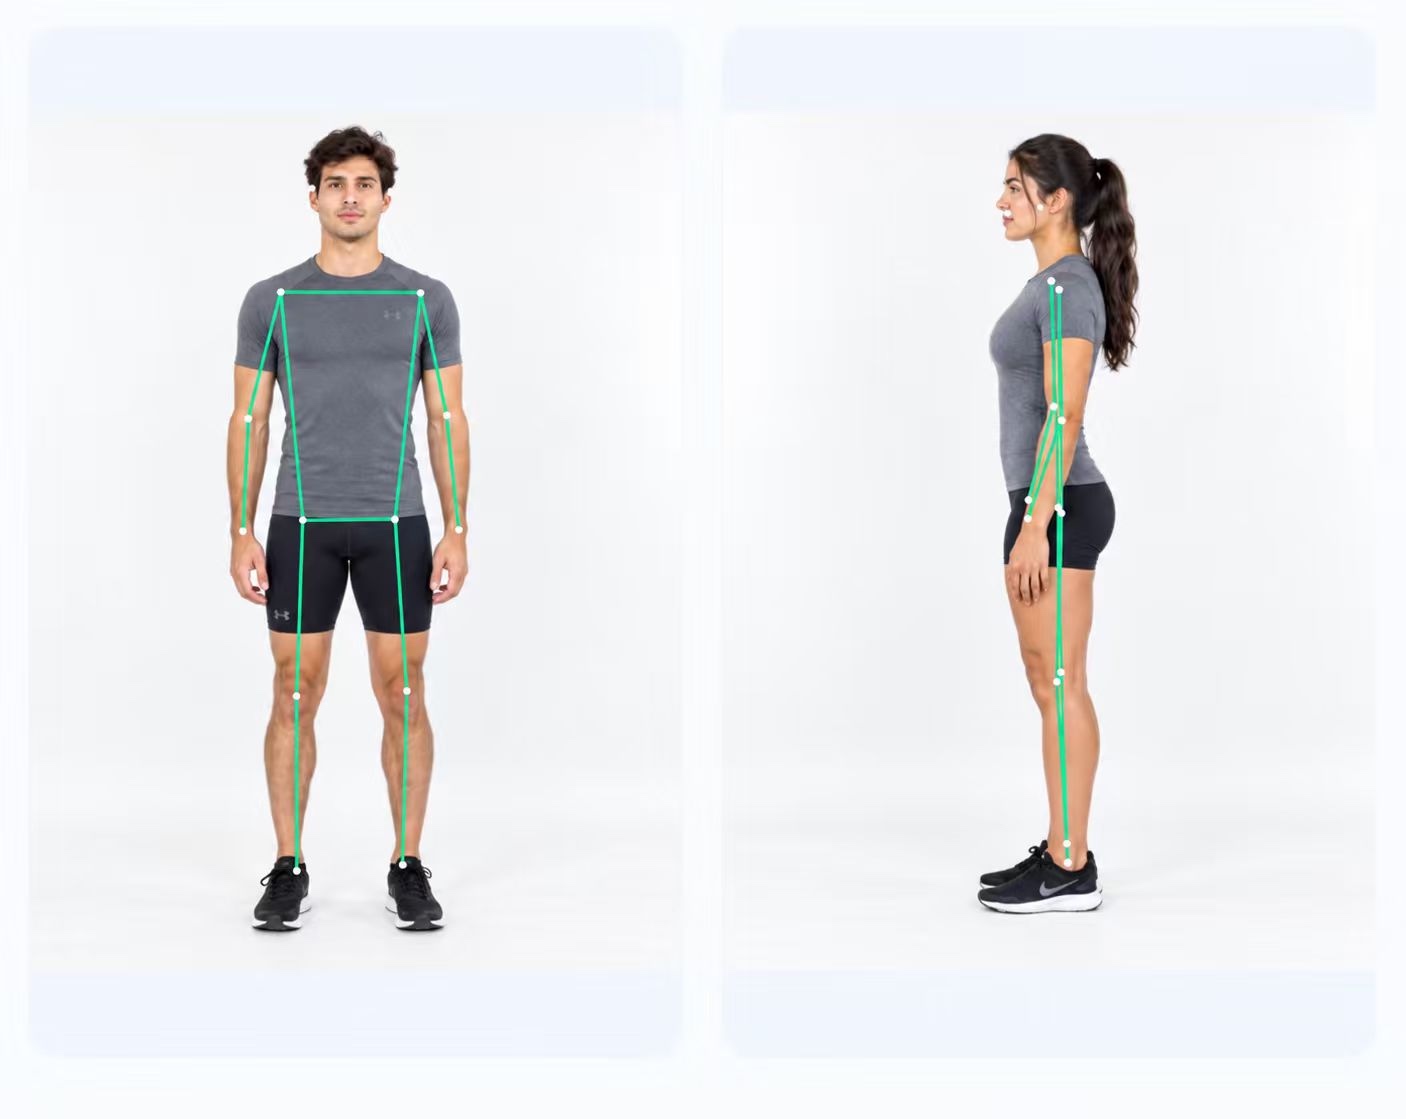
The studies cited here do not validate PoseAlign, and PoseAlign does not publish an accuracy figure or its formulas, so its values cannot be compared with the numbers on this page. Its report draws the detected landmarks over both photos, so you can inspect their placement.
What changes the number in a posture photo
Studies point to the camera setup, landmark visibility and the way you stand.
- Camera position. Camera height, distance and software differ between published studies, which the 2017 review gives as one reason no normal values for sagittal posture angles exist.
- Hidden landmarks. The SAPO authors note that head rotation or tilt can partly hide markers. In the APECS study, the shoulder marker was not clearly visible in the side view, which made that measure harder to rate. Loose clothing and hair over the ear have the same effect.
- How you stand. In a 2021 study of 66 physical therapists and physical therapy students photographed standing over a video call, the average neck angle was 50.7° in a relaxed stance and 55.5° when they were asked to stand in their best posture.
- Sitting or standing. A 2024 study of 98 young adults measured a smaller craniovertebral angle sitting (47.8° on average) than standing (50.0°).
- Foot position. In a 2024 study of 150 adults aged 18 to 30, people did not repeat a self-chosen foot position exactly across three days; the authors suggest tracing the feet so the position can be copied.
- The day itself. The Boland authors suggest that energy level or recent exertion may change posture between visits.
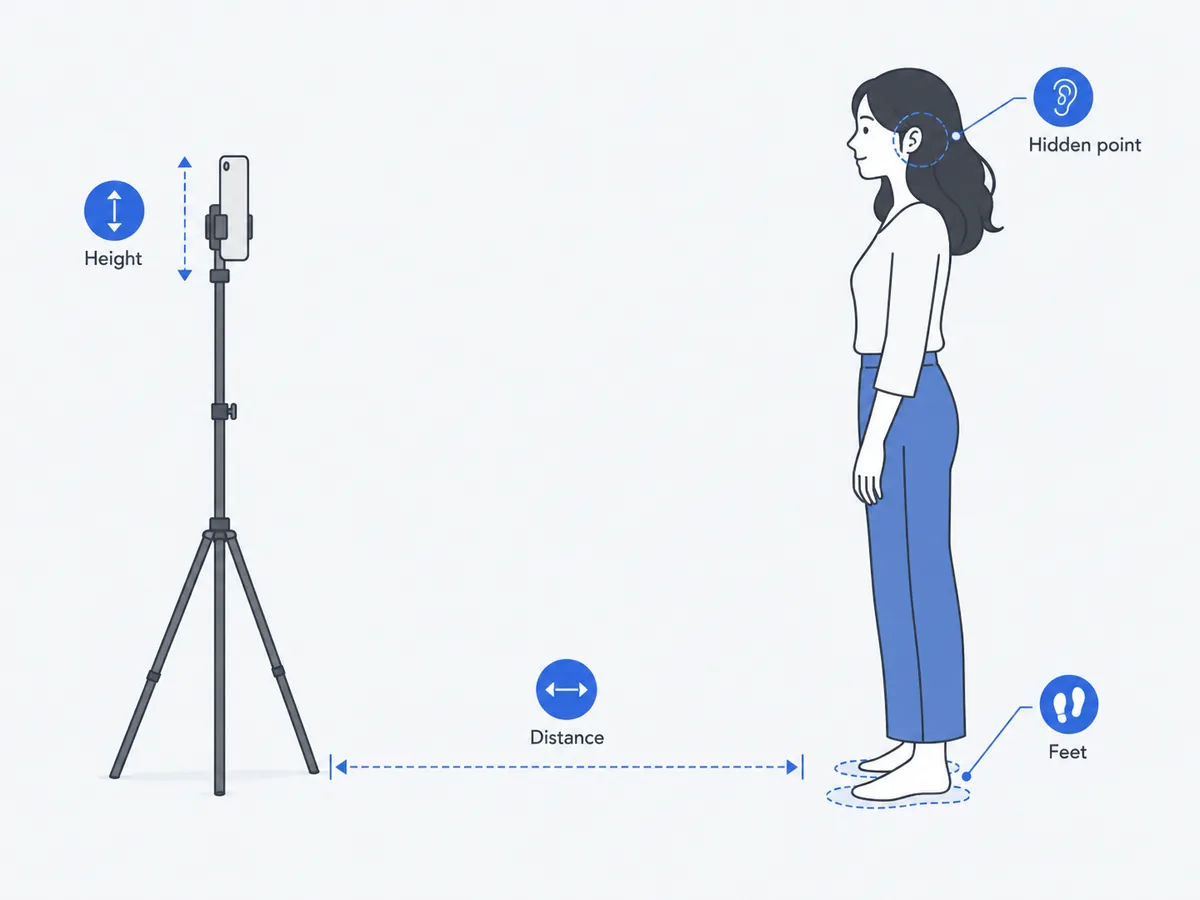
Our guide to taking front and side posture photos turns these findings into a setup you can repeat at home.
What photos cannot show
A posture photo shows the outside of the body from two directions at one moment. Landmarks sit on skin or clothing, and the 2022 review notes that surface points at the ear and the base of the neck cannot be located as accurately as on an X-ray. Twisting of the spine or pelvis, and curves outside the photo's plane, are hard or impossible to see. A photo cannot show why you stand a certain way, whether a position causes pain, or how you sit and move during the day. For the neck in particular, see what the forward head angle in a side photo can and cannot tell you.
How to use photo results
- Standardize the photos. Same place, distance, camera height, clothing and time of day.
- Check the landmarks before the numbers. If a point sits off the joint, retake the photo. The PoseAlign report page shows how the landmarks appear over both photos.
- Measure your own noise. Take two sets of photos a few minutes apart. A value that changes noticeably between them will not show small real changes.
- Compare yourself with yourself. A difference that repeats across several careful checks says more than one photo, and app values are not comparable with study values or with other apps.
- Take questions to a professional. A photo value is not a reason for concern on its own. The NHS advises seeing a GP for back pain that does not improve after a few weeks, or if your back has changed shape or has a lump or swelling, and lists the symptoms that need urgent care. A doctor or physiotherapist can examine you and decide whether imaging is needed.
For the full home routine, from choosing a method to repeating the check, start with how to check your posture at home with your phone.
How this guide was made
We collected studies from the first page of Google results for "how accurate is photo posture analysis" and from PubMed and PubMed Central, kept those that measured standing posture from photos or tested a posture app, and opened every paper linked here on 8 October 2026. Sample sizes and populations are taken from each paper. We did not run accuracy tests of our own. PoseAlign is our app, and none of the studies on this page tested it.