
BLOG
Q angle measurement: why the normal ranges disagree, and where a photo fits
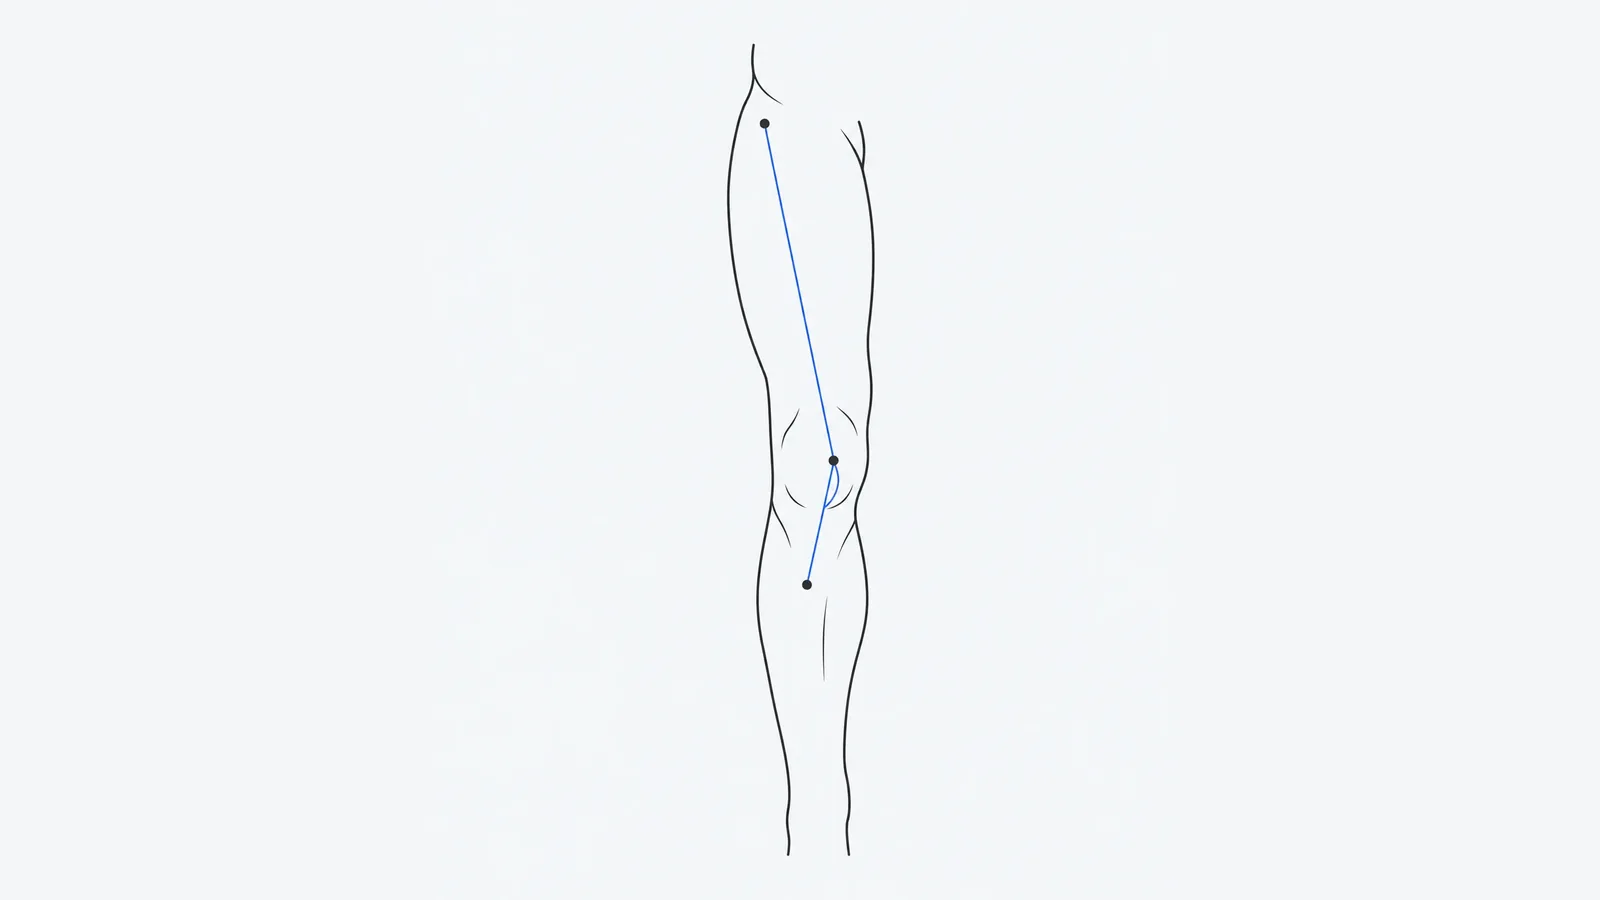
There is no single normal Q angle. Published upper limits run from 15° to 22°, depending on the source, whether the person stands or lies down, and how bent the knee is, and most sources give women a few degrees more than men. A photo app's Q angle uses different body points again, so it cannot be checked against any of these ranges. Below are the published figures side by side, and what a photo value is still good for.
What the Q angle measures
The Q angle (quadriceps angle) is the angle at the kneecap between a line from the ASIS, the bony point at the front of the hip, to the centre of the patella, and a line from the patella to the tibial tuberosity, the bump on the shin just below the kneecap (Raveendranath et al., 2011). A systematic review describes it as an index of the combined pull of the thigh muscles and the patellar tendon, used as an indicator of kneecap joint problems (Smith, Hunt and Donell, 2008). That use is weaker than it sounds: a 2019 systematic review and meta-analysis of 18 prospective studies (4,818 military recruits, adolescents and recreational runners) found strong to moderate evidence that the Q angle did not predict who later developed kneecap pain (patellofemoral pain), and a 2022 literature review describes a large overlap in Q angles between people with and without symptoms. Each knee has its own value.
Published normal values, side by side
| Source | How it was measured | Figures given |
|---|---|---|
| Physiopedia | Knee straight | Under 22° for women, under 18° for men; "typical" 17° and 12°. A later paragraph on the same page gives 13–18° for women and 12–15° for men. |
| Khasawneh et al., 2019 | Standing, goniometer, 500 students aged 18–25 in Jordan | Mean 17.35° for women, 14.1° for men; cites 12–20° as the commonly accepted range |
| Raveendranath et al., 2011 | Lying on the back, quadriceps relaxed, 200 legs of 100 adults in India | Mean 12.73° |
| Radiopaedia | Knee bent about 25° | Under 15° normal; about 20–25° or more abnormal |
We took these figures from each linked page on 2026-10-08. They differ because the measurement itself differs. Physiopedia notes that the angle can be taken lying down or standing and that it gets smaller as the knee bends, and Raveendranath et al. suggest that standing, with weight on the legs, may increase the difference between sides. Reliability is a second problem: the 2008 review of ten studies found "considerable disagreement" on the reliability and validity of the clinical Q angle and put it down to a lack of standardisation. A 2022 review reports agreement between raters for the conventional static Q angle as low to moderate, with ICCs from 0.20 to 0.70 in adults (1 means perfect agreement). In short, each figure in the table describes the group and method that produced it; none is a cut-off for judging your own knee.
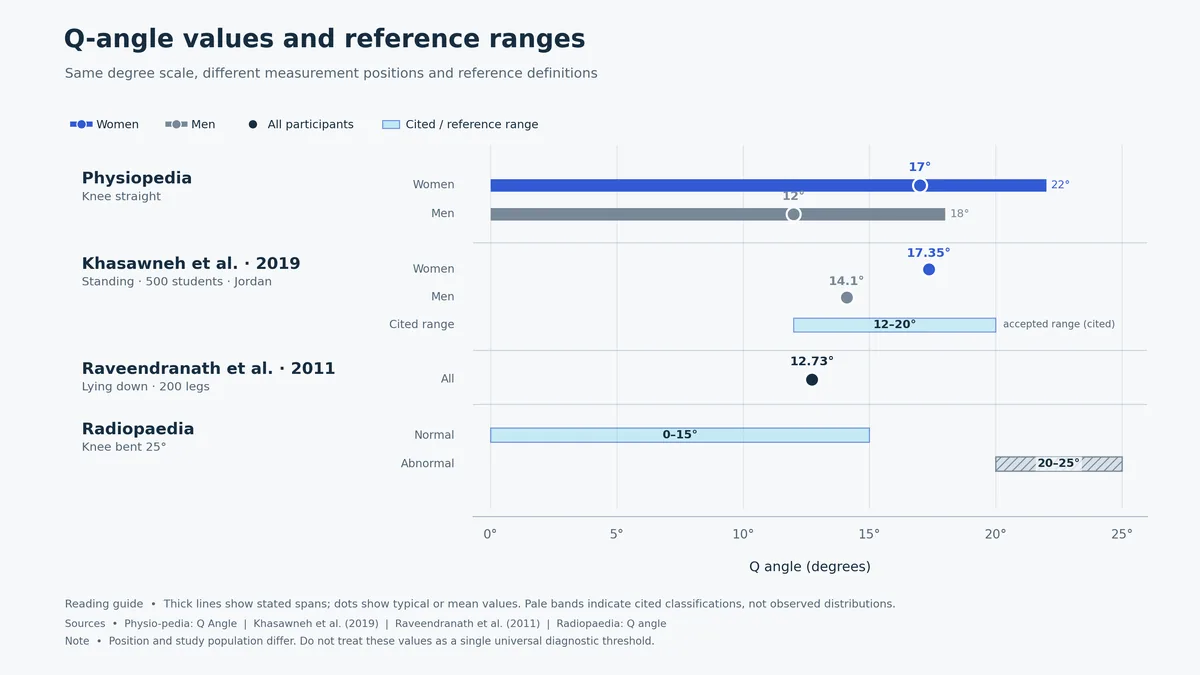
Photo measurement compared with a goniometer
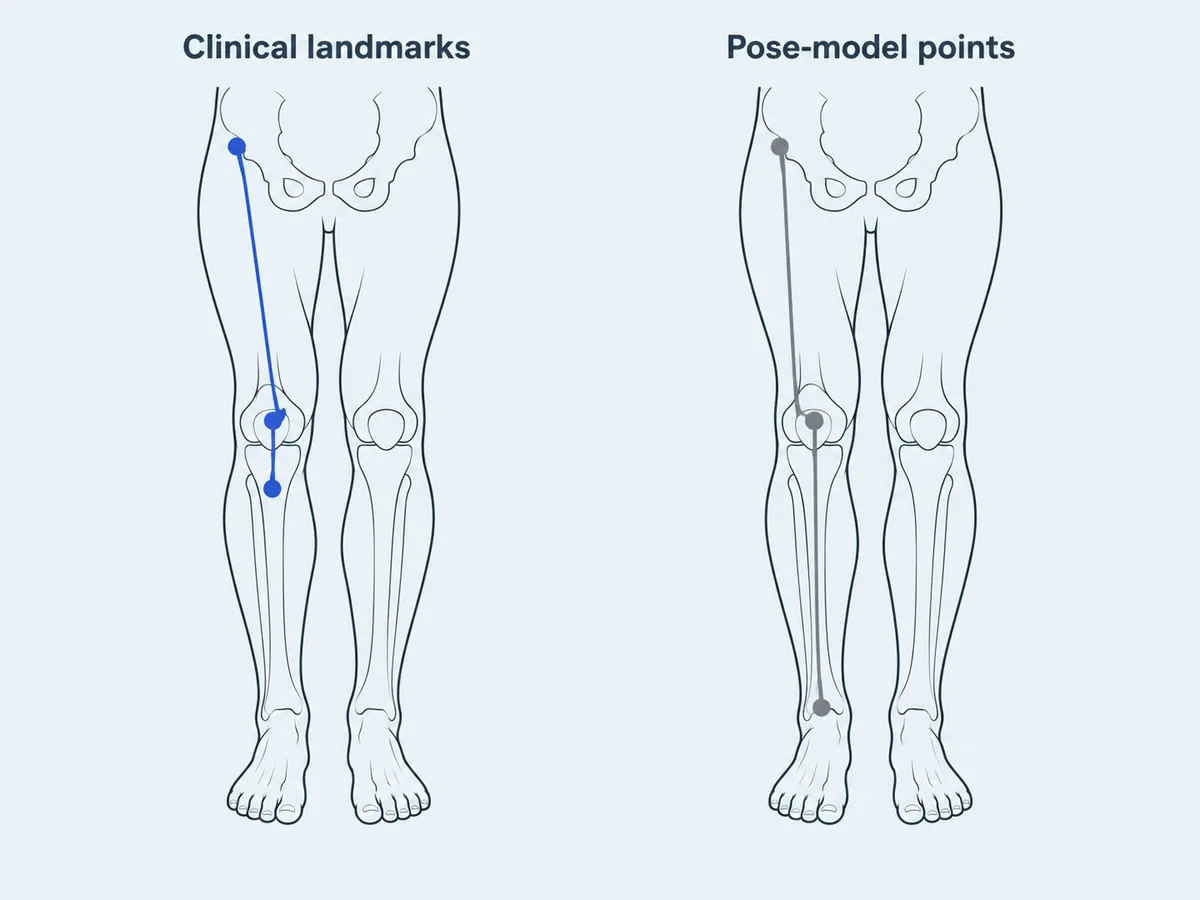
Even with markers on the right bones, a photo and a goniometer do not give the same Q angle. A 2007 Brazilian study measured four leg angles in 26 adults without symptoms, with adhesive markers on the ASIS, patella and tibial tuberosity and a camera on a tripod 3 m away at knee height (70 cm) (Sacco et al., 2007). The Q angle was the only angle that differed significantly between the goniometer and the photo software, while two different software programs agreed with each other. The authors advised care when comparing Q angles from different assessment methods, and pointed to the long distance between the reference points, the muscle around them and the several joints the angle spans.
Why a phone app's Q angle is its own scale
A phone app without markers cannot see the ASIS, the patella centre or the tibial tuberosity. Google's MediaPipe Pose Landmarker, a public pose model, estimates hip, knee and ankle points and has none of those three landmarks. A Q angle calculated from points like these is defined by the app, so none of the ranges in the table above applies to it.
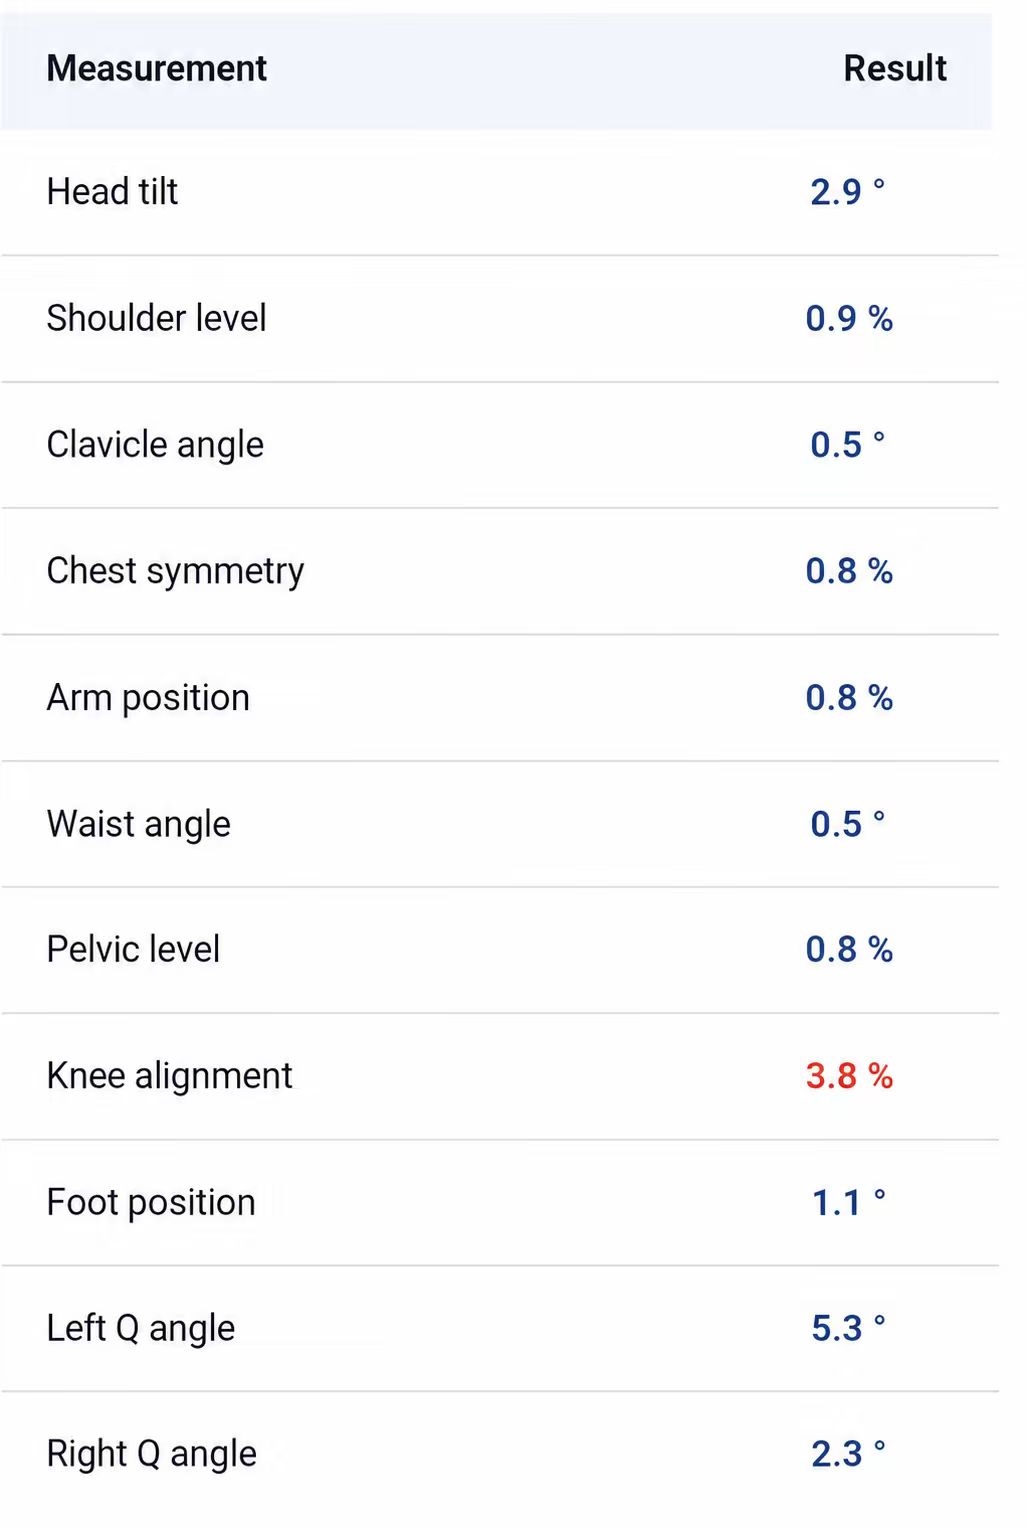
PoseAlign, a free Android posture analysis app, reports a left and a right Q angle in its front-view table. In the latest example on the site they read 5.3° and 2.3°. PoseAlign does not publish the formula, and the example values are not targets.
How different are left and right?
In Raveendranath et al.'s 100 healthy young adults, measured lying down, 36% had the same Q angle on both sides. Of those with a difference, most differed by 1°, and only 4 people differed by more than 3°. Differences were more common in men (76% of the 50 men) than in women (52% of the 50 women).
The PoseAlign example shows a 3.0° gap between left and right. Because the app's angle is on its own scale, that gap cannot be read against the study's figures. In a photo, the stance can also create or hide a gap: weight on one leg, one foot turned out more than the other, or the body turned slightly toward the camera all move the knee point relative to the hip.
Using the Q angle rows over time
A photo Q angle is useful only against your own earlier photos, taken the same way. Wear shorts, stand barefoot with feet hip-width apart and pointing forward, keep your thighs relaxed, and keep the phone level at the same height and distance each time. Then check on the overlay that the hip, knee and ankle points sit on the right spots before you compare the rows.
PoseAlign is not a medical device and cannot tell you whether a knee is healthy. For knee pain, the NHS advises seeing a GP if it does not improve within a few weeks, and getting urgent advice if the knee is very painful, cannot take weight, is badly swollen or has changed shape, or locks or gives way; a doctor or physiotherapist examines the knee directly. For the shape of the whole leg, see knock knees or bow legs from a photo, and for the other rows of the report, how to read a posture analysis report.